What Is the Difference Between AOV and Revenue per Visitor?
AOV measures revenue per order. Revenue per visitor includes non-buyers too. See the formulas, a worked example and how to compare store changes.
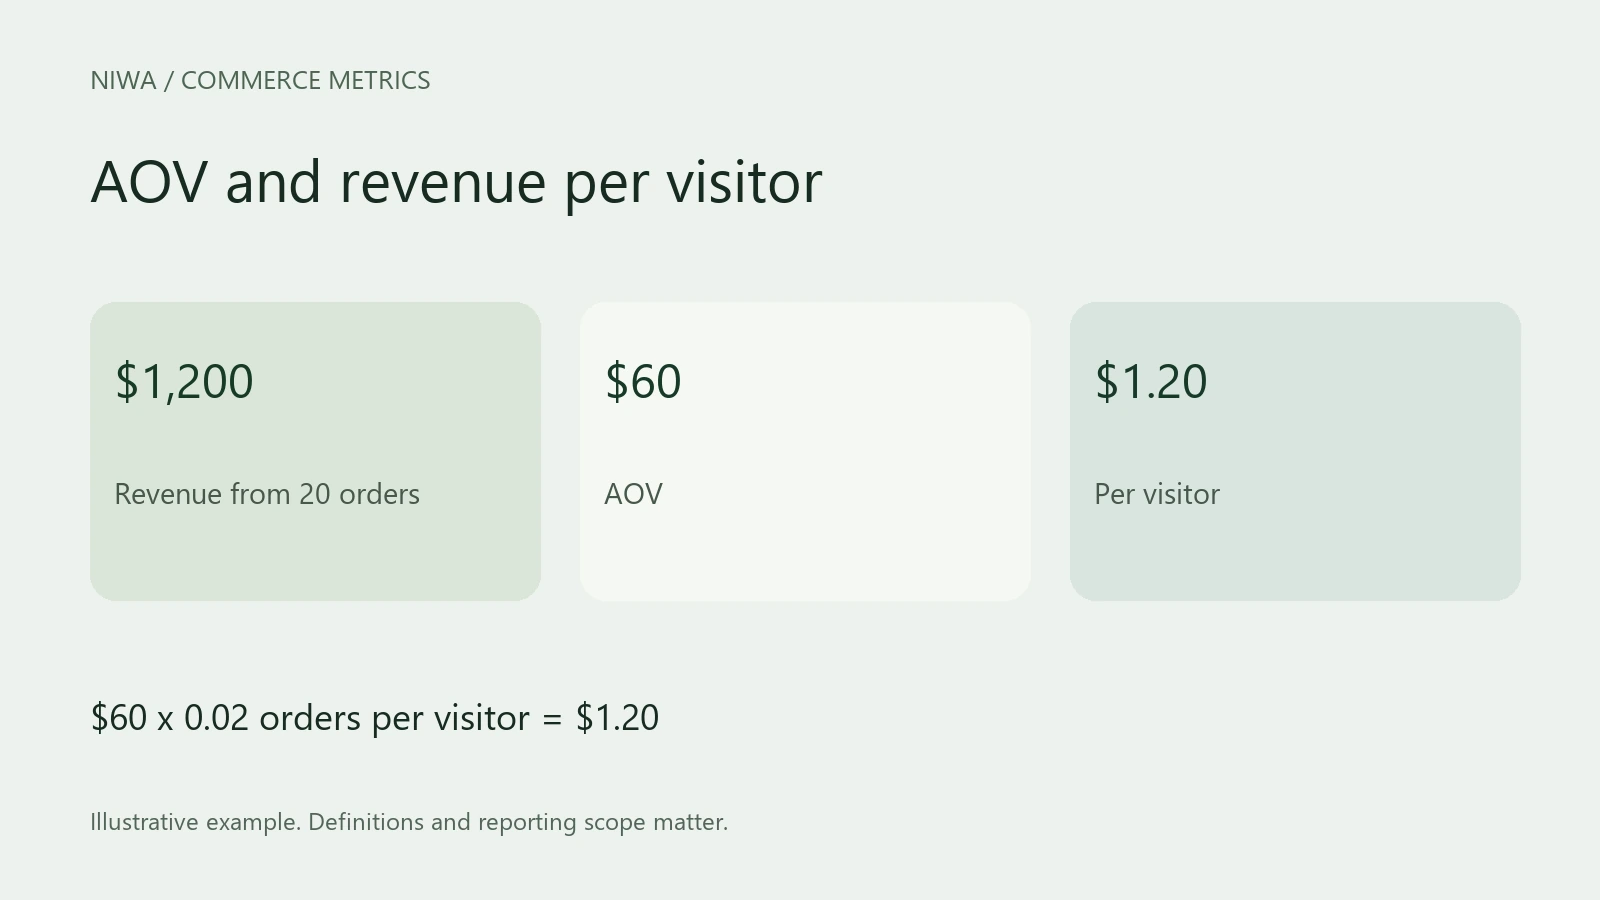
Average order value measures revenue per order. Revenue per visitor measures revenue per visitor, including people who do not buy. AOV describes the size of purchases; revenue per visitor describes how much revenue a defined traffic audience generates.
Use both when evaluating a new offer or Niwa's product guidance. An assistant could help more people complete a modest purchase while the average basket stays the same. AOV alone would miss that change.
The two formulas
AOV = included revenue divided by included orders
Revenue per visitor = included revenue divided by included visitors
Define "visitor" before comparing results. A unique user, an active user and a session are different denominators. One person can visit several times. If you divide by sessions, label the metric revenue per session.
Google Analytics' monetization reporting includes user-based revenue measures. Check the exact metric you select instead of assuming every revenue-per-user card matches your own visitor calculation.
Keep the revenue definition consistent too. Comparing net product revenue per order with tax-inclusive total revenue per visitor creates an unnecessary mismatch.
A worked example
Suppose 1,000 measured visitors generate 20 orders and $1,200 in included revenue:
- AOV is $1,200 divided by 20, or $60.
- Revenue per visitor is $1,200 divided by 1,000, or $1.20.
- Orders per visitor are 20 divided by 1,000, or 2%.
Using those same definitions, revenue per visitor equals AOV multiplied by orders per visitor: $60 multiplied by 0.02 gives $1.20.
Be precise about conversion rate. If it counts purchasers rather than orders, the identity changes when one person places several orders. Orders per visitor is the denominator-compatible ratio in this example.
How can AOV rise while revenue per visitor falls?
Imagine a second period with 1,000 visitors, 12 orders and $900 revenue. AOV rises to $75, but revenue per visitor falls to $0.90.
People who bought spent more. Fewer purchases came from the traffic audience, so the site produced less revenue per visitor overall.
This can happen when a promotion encourages bigger baskets but discourages small purchases, when an expensive product receives more exposure, or when the traffic mix changes. Those are hypotheses to inspect, not explanations you can infer from the two averages alone.
The reverse can happen too. More small orders may reduce AOV while increasing revenue per visitor and total contribution.
Compare a Niwa workflow on the same basis
Choose one customer task, such as comparing two product models. Give Niwa accurate catalog descriptions, prices, variants and availability. Test that the answer explains meaningful differences and offers a clear route to the selected product.
For evaluation, record visitors, orders and revenue for comparable audiences and periods. Keep campaign, device and customer mix visible. If running a controlled comparison, use a defined assignment method and measure the same audience in both groups.
Review contribution and refunds as well. Revenue per visitor can rise through aggressive discounting without creating more profit.
What if analytics and store revenue disagree?
Store order records and browser analytics observe different things. Missing purchase events, duplicate events, consent choices, blockers, different timezones and refund handling can affect agreement. Reconcile the definitions and a few known transactions before making a performance claim.
Niwa's customer assistance can support the buying decision, while WooCommerce remains the source for its native order figures. Introducing an assistant does not remove the need for reliable tracking.
Ask about Niwa for your store and describe the comparison or product-choice question you want customers to complete. Existing WordPress owners can start with the standalone plugin.