Why Did My Website Conversion Rate Drop?
A falling conversion rate may reflect a technical incident, changed visitors or changed measurement. Reconcile records and locate the first affected step.
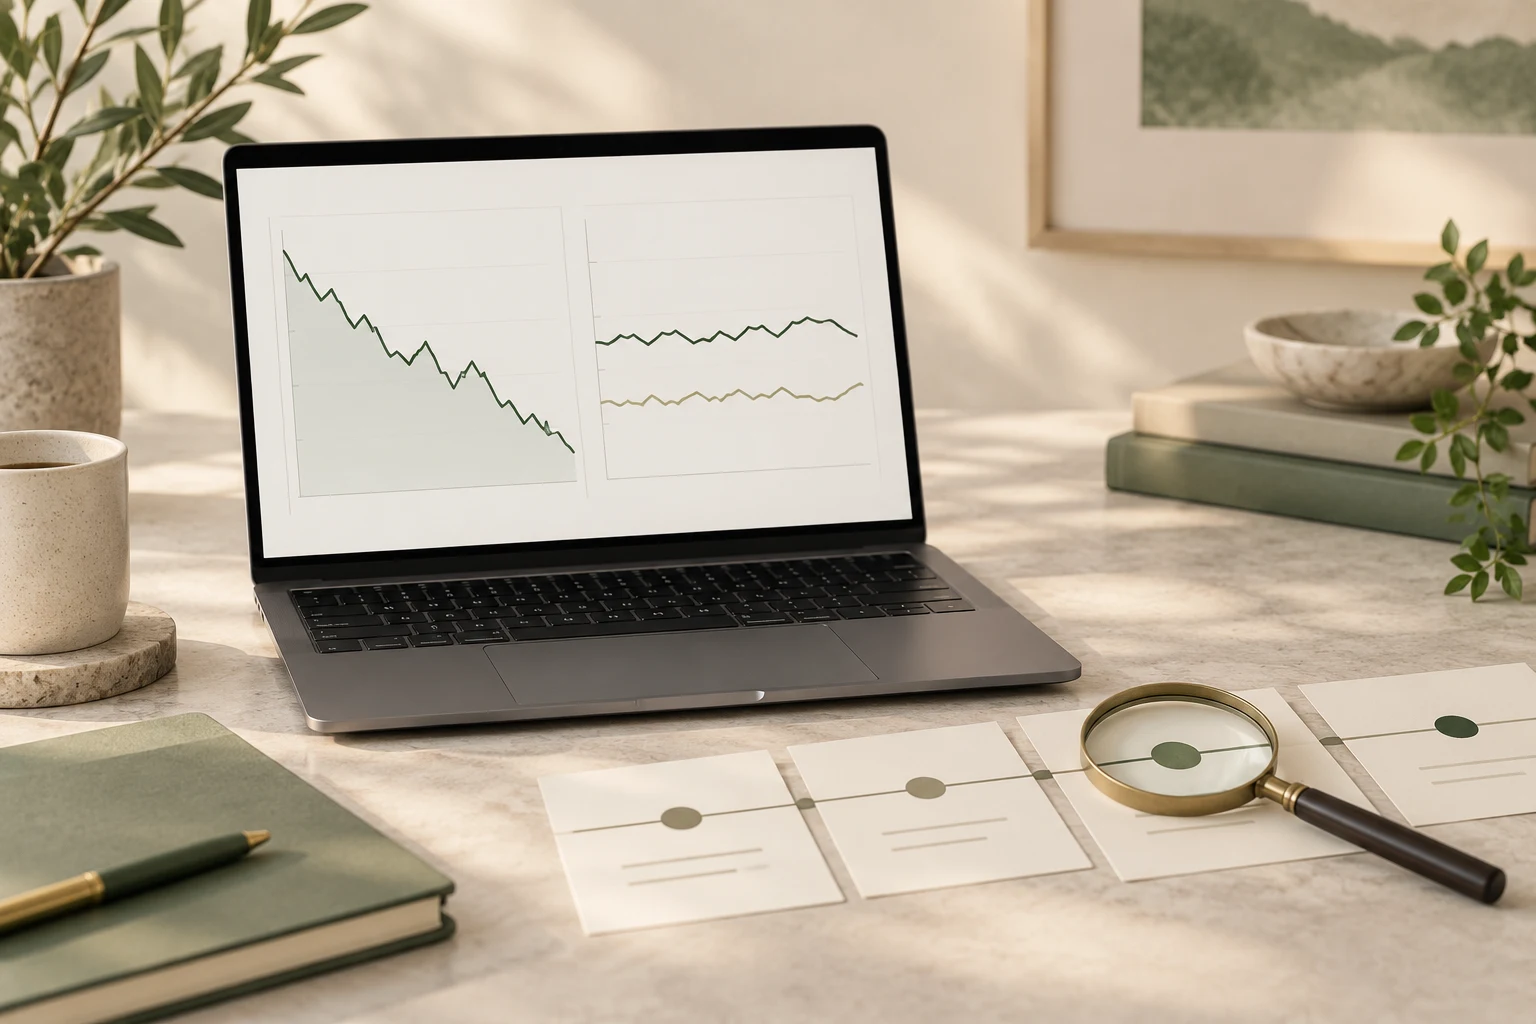
Your website conversion rate can drop because fewer similar visitors complete the buying journey, because the mix of visitors changed, or because the measurement changed. Check paid orders or qualified enquiries against analytics before assuming the website has become less effective.
Then identify when the change began and which source, device, page or journey step changed with it. A sharp checkout failure after an update needs a different response from a gradual increase in research traffic.
Niwa's storefront assistant answers product questions from your catalog and website business information, then helps the customer compare options or update the cart. The questions customers ask can also show which changed product details or delivery terms need a clearer explanation.
Confirm the business outcome outside the chart
Compare your current and earlier paid-order records, qualified enquiries or saved bookings. Use the same outcome definition, date boundaries and treatment of tests. Check whether the fall appears in the business records as well as the analytics report.
If the store still records the expected sales but analytics falls, investigate events and collection conditions. A tagging change, a different conversion definition or changed tracking coverage can alter what is observed.
Use GA4 DebugView to examine an appropriately configured test journey. Do not assume that one event appearing establishes complete reporting across every browser or source.
If the records show a real fall, continue investigating the customer path. Fixing the chart alone will not repair the underlying purchase problem.
Ask whether the comparison contains similar visitors
Break the change down by traffic source, landing page, device and markets served. Align equivalent weekdays and account for obvious trading differences such as closures, promotions or stock shortages. Use enough context to judge the period rather than treating yesterday as a universal baseline.
Google distinguishes traffic-source scopes, so keep the dimension consistent. A session-source view and a first-user-source view can answer different questions.
For example, in an earlier period, 200 high-intent visits yield 10 orders and 200 research visits yield two. That is 12 orders from 400 visits, or 3%. Later, the same groups yield 10 orders from 200 high-intent visits and eight from 800 research visits. The total is 18 orders from 1,000 visits, or 1.8%.
The blended rate fell while orders rose and each group's rate stayed unchanged. That example shows why the headline rate needs context.
Build a dated change timeline
Record changes to the theme, checkout, payment provider, form, hosting, stock, delivery terms and campaigns. Include the earliest time a problem was observed, not just when someone noticed the report.
Then ask which change could affect the step that actually deteriorated. A product stock change can alter availability. A form update can affect submission. A delivery-price change can affect the payable offer. These are candidates, not conclusions based on timing alone.
In WooCommerce, the System Status report helps establish the installed environment. Preserve relevant error evidence before making several changes that would obscure what happened.
Avoid rolling back an entire site simply because an update occurred nearby. Isolate the affected behavior, use an appropriate test environment and preserve unrelated work and orders.
Find the first step that changed within a comparable group
Choose a group with enough relevant activity to inspect. Compare its product interest, carts, checkout starts and paid orders across the two periods, using a stable counting method.
If product interest falls first, investigate entry pages, offer availability and audience. If checkout starts remain similar but paid orders fall, inspect payment and checkout records. If form submissions are stable but usable enquiries fall, examine delivery and lead handling.
Where payment attempts fail, use the provider's reason. Stripe separates decline and integration failure categories, so do not label every failed attempt a broken website.
Reproduce the affected path with its important conditions. Testing an unrelated product on a different device can miss the incident.
Use recent questions to explain the remaining uncertainty
Read a limited, authorized sample of customer enquiries around the change. Look for concrete facts the business can verify: an unavailable size, confusing new delivery terms, uncertainty about a changed service or difficulty finding the current product.
Niwa can use accurate catalog and business data to help customers while the owner reviews those questions. If a new product lacks a required specification, confirm it and update the description through an approved workflow. Do not let the assistant invent it.
The conversation intelligence guide discusses using customer questions for improvements. Keep that evidence alongside actual records; conversation patterns and a chart moving together are not proof of causation.
Verify the repair with the same outcome
After repairing a reproducible failure, confirm the complete journey and inspect the affected group again. Keep the outcome definition and traffic context stable. Do not declare recovery because a test order passed or a handful of visits converted.
For a traffic-mix explanation, assess whether the new visitors serve a commercial purpose and have an appropriate next step. For an information gap, measure suitable progress after the verified answer becomes available.
Existing WordPress owners can install the standalone plugin. Niwa Business is USD 150 for a custom WordPress site or migration, hosting, maintenance and business-specific AI adaptation. Contact Niwa with the date, affected journey and customer question to discuss a setup tied to the evidence.