What Is the Difference Between AOV and Customer Lifetime Value?
Average order value measures one purchase. Customer lifetime value covers a customer relationship. Learn the difference and avoid misleading LTV estimates.
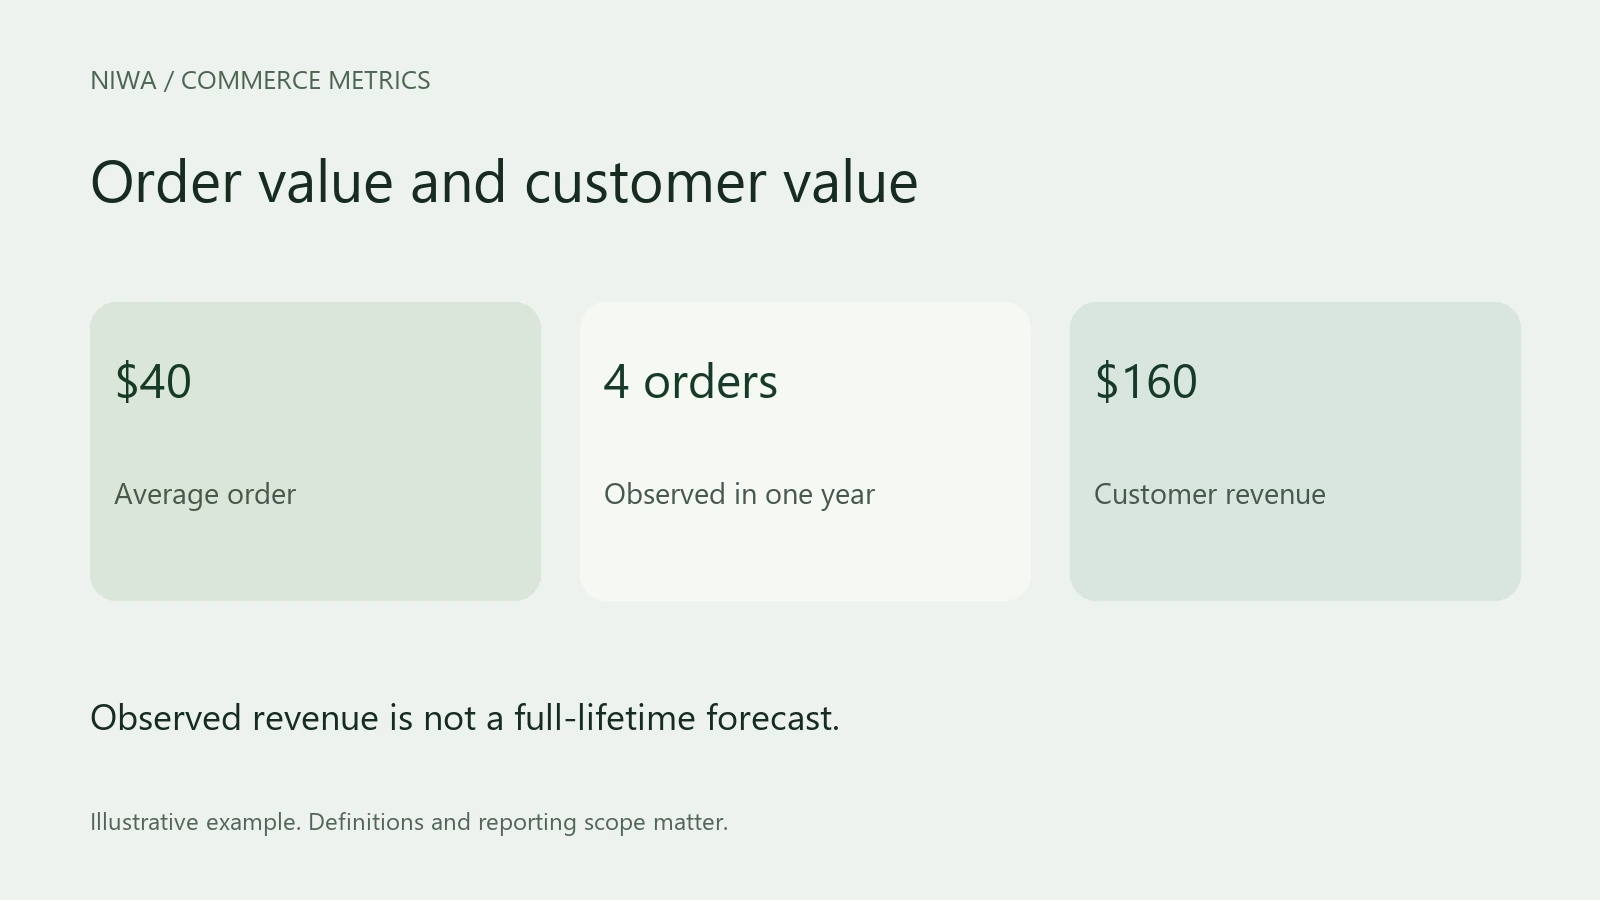
Average order value (AOV) measures revenue per order. Customer lifetime value (CLV or LTV) measures the value of a customer relationship over time. AOV is about purchases; lifetime value includes repeat purchases and a defined time horizon or forecast.
Always check whether an LTV report means revenue, gross profit or another contribution measure. Those values are not interchangeable.
Niwa helps customers use the store's product information to choose a suitable purchase. Evaluate that journey through first-order outcomes and later repeat behavior rather than assuming a larger first basket creates a more valuable customer.
A customer can have modest orders and substantial value
Suppose a customer places four $40 orders over a year. Their average order is $40 and their observed revenue over that year is $160.
Another customer places one $100 order and never buys again during the same observation window. Their order is larger, but the first customer has produced more observed revenue.
Neither figure proves the customer's complete lifetime value. Customers may buy again after the observation period ends. Be explicit when your report is twelve-month revenue rather than a forecast of the full relationship.
How does AOV enter an LTV estimate?
A simple revenue-based estimate can multiply AOV by expected order frequency and expected relationship length. For example, $40 per order multiplied by three orders per year and two years gives $240 expected lifetime revenue.
The arithmetic is straightforward. The assumptions are the difficult part. A new store may not have enough history to estimate a two-year relationship. Product seasonality, churn and changing customer behavior can make the forecast unreliable.
If you need contribution-based LTV, account for product costs, refunds and relevant variable costs. Revenue-based LTV should not be treated as an advertising budget you can spend in full.
Metorik's customer report documentation illustrates why definitions matter: its average lifetime value uses total spend divided by customer count. Read the selected tool's definition before comparing its LTV with another model.
Use cohorts to compare customers fairly
A cohort groups customers by a shared starting point, such as the month of their first purchase. Compare those cohorts at the same age. A twelve-month-old group has had more time to buy again than customers acquired last week.
Metorik's cohort documentation describes tracking customer value through the months after the first order. This approach helps distinguish a stronger initial basket from improved repeat behavior.
Keep customer identity consistent. Guest checkout, changed email addresses and shared accounts can affect the count. Review how your reporting tool joins purchases before assuming every row represents one unique person.
A relevant product journey for Niwa
For a replenishment store, start with the question that helps a customer choose correctly: which size, which compatible item or which quantity suits their use. Prepare accurate descriptions and configure product relationships that support that need.
Test Niwa's answer and the route to the product. After launch, review refunds, customer questions and repeat purchases alongside initial AOV. An unsuitable add-on could increase the first basket and undermine the relationship you hoped to build.
Do not assume later revenue was caused by the assistant. Product quality, acquisition source, pricing and the service after purchase also shape repeat behavior.
Which metric should you prioritize?
Use AOV to understand current baskets and offers. Use observed customer value and carefully labeled forecasts for retention and acquisition decisions. Track contribution to understand what those purchases leave in the business.
Discuss your store's customer journey with Niwa. The standalone plugin serves existing WordPress sites. Niwa Business is USD 150 and includes a custom WordPress site or migration, hosting, maintenance and AI adaptation for the business.